Dubai apartment and villa sales fell 44.3 percent in October 2026 while same-homes prices fell 0.67 percent
In October 2026, Dubai apartment and villa sales fell 44.3 percent to 10,180 deals, while same-homes prices fell 0.67 percent across 18 matched home groups.
Apartment and villa sales
10,180
down 44.3% against October 2025up 0.9% against September 2026
Apartments
8,286 sales
down 47.0% against October 2025, from 15,644
Villas
1,894 sales
down 27.7% against October 2025, from 2,618
First sales (primary)
6,366 sales
down 51.8% against October 2025, from 13,196
Resales (secondary)
3,813 sales
down 24.7% against October 2025, from 5,065
- First sales 6,366, 62.5%
- Resales 3,813, 37.5%
- Off plan 6,756, 66.4%
- Ready 3,424, 33.6%
Off plan was 73.8% in October 2025
Based on 10,180 recorded sales, October 2026.
Across 10,180 apartment and villa sales worth AED 25.12 billion, middle prices fell 2.5 percent while same-homes prices fell 0.67 percent. The same-homes measure compares this month with the same month last year, for the same types and sizes of home, sold the same way. So a change in what sold cannot move it, while new-lease same-homes rents fell 6.55 percent and renewal rents rose 3.47 percent.
The market in October 2026
10 measures of October 2026 at a glance
| Measure | This month | Versus a year ago | Versus last month |
|---|---|---|---|
| Apartment and villa sales | 10,180 | down 44.3% | up 0.9% |
| Total value | AED 25.12 billion | down 45.2% | up 7.0% |
| Median price per square foot | AED 1,668 | down 2.5% | down 1.9% |
| Same homes, all | down 0.67% | already mix adjusted | already mix adjusted |
| Same homes, excluding the leading contributor | down 0.33% | already mix adjusted | already mix adjusted |
| Median size sold | 826 sq ft | up 0.6% | up 2.2% |
| Off plan share of sales | 66.4% | down 7.4 pts | down 4.2 pts |
| Apartment and villa first sales (primary) | 6,366 | down 51.8% | down 2.3% |
| Apartment and villa resales (secondary) | 3,813 | down 24.7% | up 6.6% |
| Sales above USD 10 million | 35 | down 18.6% |
Same-homes prices compare the same types and sizes of home, sold the same way, with a year earlier, so a change in what sold cannot move them. Median means the middle sale: half sold for more and half for less. Off plan means sold before the home is built.
The register also recorded 1 sale in October 2026 as instalment sales (unclassified), too few to show in the split.
Apartments sold off plan were 49.9 percent of last year's value and 68.1 percent of the fall. Without them, value fell 28.8 percent.
Why it may have moved. 1 possible cause may have played a part. It is shown in the section whose figures it explains: Apartment.
 Why it may have moved. 1 possible cause may have played a part. It is shown in the section whose figures it explains: Apartment.
Fewer sales and lower prices.
This is one of 2 things that happened at once, each of which may explain part of this move. The other one is shown in other sections.
- New supply
Fewer new projects going on sale
This might be caused by fewer new projects going on sale (1).
It could be large enough for this move, and it points the same way the market moved.
How we knowHow we know
This might be caused by fewer new projects going on sale.
This may account for part of it, and so may other things
- Source
- Khaleej Times
- Tier
- Established press
- Happened
- Not recorded
- Reported
- 20 Aug 2026
- Read by us
- Not recorded
- Agreement
- 1 independent publisher
- What would change our mind
- The number of new projects going on sale was normal.
- Came before the move: Passed. Reported 2 months before the move, inside the 0 to 3 month window this kind of factor is expected to take. The order of events works.
- Pushes the way the market moved: Passed. The market moved down and this factor pushes the same way.
- Fits which side of the market moved: Not measured. This factor does not predict a particular shape for sales against prices, so there was nothing to compare.
- Hits the parts it should hit hardest: Not measured. This month's figures do not split the market by offplan, apartment, ready. We could not check whether it hit where it should.
- Large enough for a move this size: Passed. It can move the market by 40 percent at most; same-homes apartment and villa prices moved 0.67 percent, so it is large enough to matter.
- Has done this here before: Passed. We have no recorded case of this happening here before, so there is no track record either way. That is not evidence against it.
These may also have played a part.
- New supply
More completion delays
More completion delays (homes finishing later than scheduled) (2).
It was reported in time to play a part.
How we knowHow we know
More completion delays (homes finishing later than scheduled) is a possible factor.
This is possible and we cannot put a number on it
- Source
- Khaleej Times
- Tier
- Established press
- Happened
- Not recorded
- Reported
- 30 Jul 2026
- Read by us
- Not recorded
- Agreement
- 1 independent publisher
- What would change our mind
- Completions matched the schedule.
- Came before the move: Passed. Reported 3 months before the move, inside the 0 to 24 month window this kind of factor is expected to take. The order of events works.
- Pushes the way the market moved: Not measured. The reporting on this factor cuts both ways, so we could not say whether it pushed with the move or against it.
- Fits which side of the market moved: Not measured. This factor does not predict a particular shape for sales against prices, so there was nothing to compare.
- Hits the parts it should hit hardest: Not measured. This month's figures do not split the market by ready, plot. We could not check whether it hit where it should.
- Large enough for a move this size: Passed. It can move the market by 5 percent at most; same-homes apartment and villa prices moved 0.67 percent, so it is large enough to matter.
- Has done this here before: Passed. We have no recorded case of this happening here before, so there is no track record either way. That is not evidence against it.
- New supply
More new homes finished at once
More new homes finished at once (2).
It was reported in time to play a part.
How we knowHow we know
More new homes finished at once is a possible factor.
This is possible and we cannot put a number on it
- Source
- Khaleej Times
- Tier
- Established press
- Happened
- Not recorded
- Reported
- 30 Jul 2026
- Read by us
- Not recorded
- Agreement
- 1 independent publisher
- What would change our mind
- Fewer homes stood empty.
- Came before the move: Passed. Reported 3 months before the move, inside the 0 to 12 month window this kind of factor is expected to take. The order of events works.
- Pushes the way the market moved: Not measured. The reporting on this factor cuts both ways, so we could not say whether it pushed with the move or against it.
- Fits which side of the market moved: Not measured. This factor does not predict a particular shape for sales against prices, so there was nothing to compare.
- Hits the parts it should hit hardest: Not measured. This month's figures do not split the market by apartment, ready, plot. We could not check whether it hit where it should.
- Large enough for a move this size: Not measured. How large a move this factor can produce depends on how far the factor itself moved. This month's reporting does not say. We could not check whether it is big enough.
- Has done this here before: Passed. We have no recorded case of this happening here before, so there is no track record either way. That is not evidence against it.
Sales
11,210 sales of every type in every use in October 2026. Median price AED 1,695 per square foot.
- Against October 2025down 42.3% down 1.4%
- Against September 2026up 1.5% down 1.2%
First sales
7,000 sales
down 48.9% against October 2025, from 13,693
Resales
4,182 sales
down 27.0% against October 2025, from 5,725
Instalment sales
28 sales
- First sales 7,000, 62.4%
- Resales 4,182, 37.3%
- Instalment sales 28, 0.2%
- Across apartment and villa sales, the middle price per square foot fell 2.5 percent to AED 1,668 while same-homes prices fell 0.67 percent. Price per square foot is the price of one square foot, which lets you compare homes of different sizes across 18 matched groups.
- Total value paid for apartment and villa sales fell 45.2 percent to AED 25.12 billion, while sales value rose 7 percent from September 2026. The typical home in those sales rose 0.6 percent in size to 826 square feet, where one square metre is about 10.8 square feet.
What might explain it.
- The headline price fell 2.5 percent while the same-homes measure moved by less than one percent. It compares matched homes sold the same way, so only the mix of sales changed.
- Sales rose 0.9 percent from the month before, and half the months over the past 1 year moved at least that much.
Residential
10,784 sales of every type registered for Residential use in October 2026. Median price AED 1,692 per square foot.
- Against October 2025down 43.1% down 1.7%
- Against September 2026up 0.7% down 1.3%
First sales
6,780 sales
down 50.1% against October 2025, from 13,585
Resales
3,997 sales
down 25.3% against October 2025, from 5,352
Instalment sales
7 sales
- First sales 6,780, 62.9%
- Resales 3,997, 37.1%
- Instalment sales 7, 0.1%
Show the figures behind this chart
| Measure | Change on the year |
|---|---|
| Headline median | -2.5% |
| Same homes, all | -0.67% |
| Same homes, excluding the leading contributor | -0.33% |
Dubai Land Department registrations. Same-homes figures are already mix adjusted, so a change in what sold cannot move them.
Show the figures behind this chart
| Month | Off plan share of sales |
|---|---|
| Oct-25 | 73.8% |
| Nov-25 | 74.2% |
| Dec-25 | 75.7% |
| Jan-26 | 73.4% |
| Feb-26 | 71.1% |
| Mar-26 | 77.8% |
| Apr-26 | 79.1% |
| May-26 | 76.3% |
| Jun-26 | 75.7% |
| Jul-26 | 73.2% |
| Aug-26 | 73% |
| Sep-26 | 70.6% |
| Oct-26 | 66.4% |
Dubai Land Department registrations. Figures for earlier months can change as late registrations arrive; each edition prints what changed.
Show the figures behind this chart
| Month | Sales | Median price per square foot |
|---|---|---|
| Oct-25 | 18,262 | AED 1,710 |
| Nov-25 | 17,386 | AED 1,769 |
| Dec-25 | 17,778 | AED 1,811 |
| Jan-26 | 15,298 | AED 1,812 |
| Feb-26 | 15,355 | AED 1,762 |
| Mar-26 | 12,930 | AED 1,741 |
| Apr-26 | 12,256 | AED 1,851 |
| May-26 | 9,173 | AED 1,690 |
| Jun-26 | 12,229 | AED 1,701 |
| Jul-26 | 12,505 | AED 1,713 |
| Aug-26 | 11,056 | AED 1,715 |
| Sep-26 | 10,092 | AED 1,700 |
| Oct-26 | 10,180 | AED 1,668 |
Dubai Land Department registrations. Figures for earlier months can change as late registrations arrive; each edition prints what changed.
These figures count apartments and villas only, so they differ from the register's Residential line.
Apartments (built area)
| Segment | Sales | Price per square foot a year ago | Price per square foot now | Change |
|---|---|---|---|---|
| Studio apartment | 2,516 | 1,789 | 1,750 | down 2.2% |
| 1-bedroom apartment | 3,440 | 1,630 | 1,604 | down 1.6% |
| 2-bedroom apartment | 1,840 | 1,775 | 1,768 | down 0.4% |
| 3-bedroom apartment | 426 | 2,068 | 1,858 | down 10.2% |
| 4-bedroom apartment | 59 | 2,630 | 2,639 | up 0.4% |
Villas (plot area)
| Segment | Sales | Price per square foot a year ago | Price per square foot now | Change |
|---|---|---|---|---|
| 2-bedroom villa | 47 | 1,377 | 1,319 | down 4.2% |
| 3-bedroom villa | 428 | 1,743 | 1,677 | down 3.8% |
| 4-bedroom villa | 633 | 1,607 | 1,733 | up 7.8% |
| 5-bedroom villa | 301 | 1,617 | 1,639 | up 1.4% |
| 6-bedroom villa | 398 | 1,948 | 468 | down 76.0% |
Apartment communities (built area)
| Community | Sales | Price per square foot | On the year |
|---|---|---|---|
| Meydan Racecourse Community (Nad Al Shiba First) | 153 | 3,413 | up 42.1% |
| Palm Jumeirah | 85 | 3,319 | down 2.3% |
| Al Wasl | 59 | 3,096 | down 3.6% |
| Dubai Maritime City (Madinat Dubai Almelaheyah) | 218 | 3,095 | down 0.2% |
Villa communities (plot area)
| Community | Sales | Price per square foot | On the year |
|---|---|---|---|
| Majan (Wadi Al Safa 3) | 81 | 2,328 | up 29.1% |
| Dubai Hills Estate (Hadaeq Sheikh Mohammed Bin Rashid) | 31 | 2,197 | down 4.1% |
| Dubai Sports City (Al Hebiah Fourth) | 41 | 2,179 | up 0.9% |
| Mudon (Al Hebiah Sixth) | 47 | 1,806 | up 6.8% |
| Off plan | This month | A year ago | Change |
|---|---|---|---|
| Share of sales, by count | 66.4% | 73.8% | down 7.4 pts |
| Share of value | 63.2% | 72.8% | down 9.6 pts |
| Off plan deals | 6,756 |
Communities by value transacted (apartments and villas together)
- 1Majan (Wadi Al Safa 3)AED 1.17 billion
- 2Palm JumeirahAED 1.16 billion
- 3The Valley (Al Yufrah 1)AED 1.07 billion
- 4Dubai Hills Estate (Hadaeq Sheikh Mohammed Bin Rashid)AED 1.04 billion
- 5Dubai World Central (Madinat Al Mataar)AED 1.03 billion
- 6Al Rowaiyah FirstAED 0.98 billion
- 7Palm Jabal AliAED 0.90 billion
- 8Jumeirah Village Circle (Al Barsha South Fourth)AED 0.87 billion
Dubai Land Department registrations. Community boundaries: Dubai Municipality. Shade follows value transacted; numbers are rank.
| Community | Sales | Value | Share of value | Median price per square foot |
|---|---|---|---|---|
| Majan (Wadi Al Safa 3) | 538 | AED 1.17 billion | 4.6% | 1,452 |
| Palm Jumeirah | 95 | AED 1.16 billion | 4.6% | 3,619 |
| The Valley (Al Yufrah 1) | 256 | AED 1.07 billion | 4.2% | 1,930 |
| Dubai Hills Estate (Hadaeq Sheikh Mohammed Bin Rashid) | 183 | AED 1.04 billion | 4.1% | 2,304 |
| Dubai World Central (Madinat Al Mataar) | 808 | AED 1.03 billion | 4.1% | 1,634 |
| Al Rowaiyah First | 406 | AED 0.98 billion | 3.9% | 468 |
| Palm Jabal Ali | 35 | AED 0.90 billion | 3.6% | 3,393 |
| Jumeirah Village Circle (Al Barsha South Fourth) | 798 | AED 0.87 billion | 3.4% | 1,453 |
October 2026 · month
- What
- Median residential sales price and rate by area. Shown for: Prices ran ahead of rents.
- How
- Read from property transactions registered in Dubai since 2008 and in Abu Dhabi since 2019, one row per transaction. Each figure rests on at least 30 records. Dubai records only.
- Output
- 59 figures in AED per sq ft, each printed with its count; 12 figures resting on fewer than 30 records are left out. The 6 groups with the most records are drawn; the other 53 share one bar (10,446 records), drawn at the middle of their own figures.
Based on 14,959 records, October 2026, as recorded by 3 November 2026
Show the figures behind this chart
| Group | Median residential sales price and rate by area | Records |
|---|---|---|
| Al Barsha South Fourth | 1,366 | 1,068 |
| Madinat Al Mataar | 1,613 | 855 |
| Business Bay | 1,878 | 677 |
| Jabal Ali First | 1,285 | 672 |
| Wadi Al Safa 3 | 1,415 | 651 |
| Al Rowaiyah First | 468 | 590 |
| The other 53 | 1,604 | 10,446 |
Based on 14,959 records, October 2026, as recorded by 3 November 2026
Source: property transactions registered in Dubai since 2008 and in Abu Dhabi since 2019, one row per transaction, compiled by PropertyDynamix
- Apartment and villa first sales fell 51.8 percent in count to 6,366 deals, while apartment and villa resales fell 24.7 percent to 3,813 deals. Same-homes prices fell 0.07 percent for first sales and fell 2.21 percent for resales, showing existing owners cut prices further than developers.
- No single contributor exceeded 11.6 percent of apartment and villa sales, and same-homes prices excluding the leading contributor fell 0.33 percent. Wadi Al Safa 3 (Majan) led sales value at AED 1.17 billion across 538 deals while holding 18,654 unfinished homes in the 426,466-unit pipeline.
What might explain it.
- The headline price per square foot fell 2.5 percent, yet the same-homes measure moved by less than one percent. Homes did not really reprice, and what changed was which homes happened to sell.
- Monthly sales rose 0.9 percent, an ordinary move that half of all months in the last 1 year at least matched.
Apartment
8,286 sales of apartment property registered for Residential use in October 2026. Median price AED 1,694 per square foot.
- Against October 2025down 47.0% down 1.9%
- Against September 2026down 4.1% down 0.6%
First sales
5,407 sales
down 54.2% against October 2025, from 11,801
Resales
2,878 sales
down 25.1% against October 2025, from 3,842
Off plan
5,496 sales
down 53.2% against October 2025, from 11,752
Ready
2,790 sales
down 28.3% against October 2025, from 3,892
- First sales 5,407, 65.3%
- Resales 2,878, 34.7%
- Off plan 5,496, 66.3%
- Ready 2,790, 33.7%
426,466 apartment units are registered and not yet finished, as read on 3 November 2026. That is the count now, not at the close of the month. Taken together they are 24 percent built.
| Largest pipelines | Units | Built |
|---|---|---|
| Dubai World Central (Madinat Al Mataar) | 39,534 | 21% |
| Jumeirah Village Circle (Al Barsha South Fourth) | 33,073 | 34% |
| Dubai Land Residence Complex (Wadi Al Safa 5) | 25,683 | 17% |
| Business Bay | 22,488 | 32% |
| Majan (Wadi Al Safa 3) | 18,654 | 17% |
- Apartments sold off plan, meaning sold before being built by a developer or earlier buyer, reached 5,496 deals against 2,790 ready apartment sales. Apartment sales fell 47 percent from 15,644 deals to 8,286, steeper than the 43.1 percent drop across all 10,784 residential sales.
Why apartment sales may have moved.
Fewer sales and lower prices.
This is one of 2 things that happened at once, each of which may explain part of this move. The other one is shown in other sections.
- Rents
Lower market rents
This might be caused by lower market rents (tenants paying less) (3).
Sales and prices moved as it predicts.
How we knowHow we know
This might be caused by lower market rents (tenants paying less).
This may account for part of it, and so may other things
- Source
- Gulf News
- Tier
- Established press
- Happened
- Not recorded
- Reported
- 29 Jul 2026
- Read by us
- Not recorded
- Agreement
- 1 independent publisher
- What would change our mind
- Rent as a share of price moved a lot, so prices moved apart from rents rather than with them.
- Came before the move: Passed. Reported 3 months before the move, inside the 1 to 18 month window this kind of factor is expected to take. The order of events works.
- Pushes the way the market moved: Passed. The market moved down and this factor pushes the same way.
- Fits which side of the market moved: Passed. Sales and prices together moved exactly the way this factor should move them (volume down, price down).
- Hits the parts it should hit hardest: Not measured. This month's figures do not split the market by apartment, plot, offplan. We could not check whether it hit where it should.
- Large enough for a move this size: Not measured. How large a move this factor can produce depends on how far the factor itself moved. This month's reporting does not say. We could not check whether it is big enough.
- Has done this here before: Passed. We have no recorded case of this happening here before, so there is no track record either way. That is not evidence against it.
Villa
1,894 sales of villa property registered for Residential use in October 2026. Median price AED 1,527 per square foot.
- Against October 2025down 27.7% down 6.2%
- Against September 2026up 30.3% down 8.2%
First sales
959 sales
down 31.3% against October 2025, from 1,395
Resales
935 sales
down 23.5% against October 2025, from 1,223
Off plan
1,260 sales
down 27.2% against October 2025, from 1,731
Ready
634 sales
down 28.5% against October 2025, from 887
- First sales 959, 50.6%
- Resales 935, 49.4%
- Off plan 1,260, 66.5%
- Ready 634, 33.5%
- Off plan villa deals reached 1,260 sales against 634 ready villa sales, putting most villa activity into homes not yet built. The 27.7 percent annual drop in villa sales was smaller than the 43.1 percent fall across all 10,784 residential sales.
What might explain it.
- Half the months in the last 1 year moved at least as much against the prior month, making the monthly shift ordinary variation.
Residential, other and commercial uses, counted rather than read one by one
| Kind of property | Records, October 2026 | Against September 2026 |
|---|---|---|
| Registered for Residential use, other than apartments and villas | 604 | down 2.1% |
| Office | 308 | up 28.3% |
| Hotel Apartment | 202 | down 23.5% |
| Retail | 94 | down 16.8% |
| Registered for Other use | 288 | up 196.9% |
| Land | 275 | up 271.6% |
| Smaller groups: Building | 13 | |
| Registered for Commercial use | 138 | down 40.8% |
| Office | 91 | down 50.5% |
| Smaller groups: Land, Building and Retail | 47 |
Each group's first line is its total, and the lines beneath it add up to that total. These are other kinds of property, or uses where other property makes up most of the records. They are counted here, not given a section of their own.
The 10 largest sales recorded in October 2026
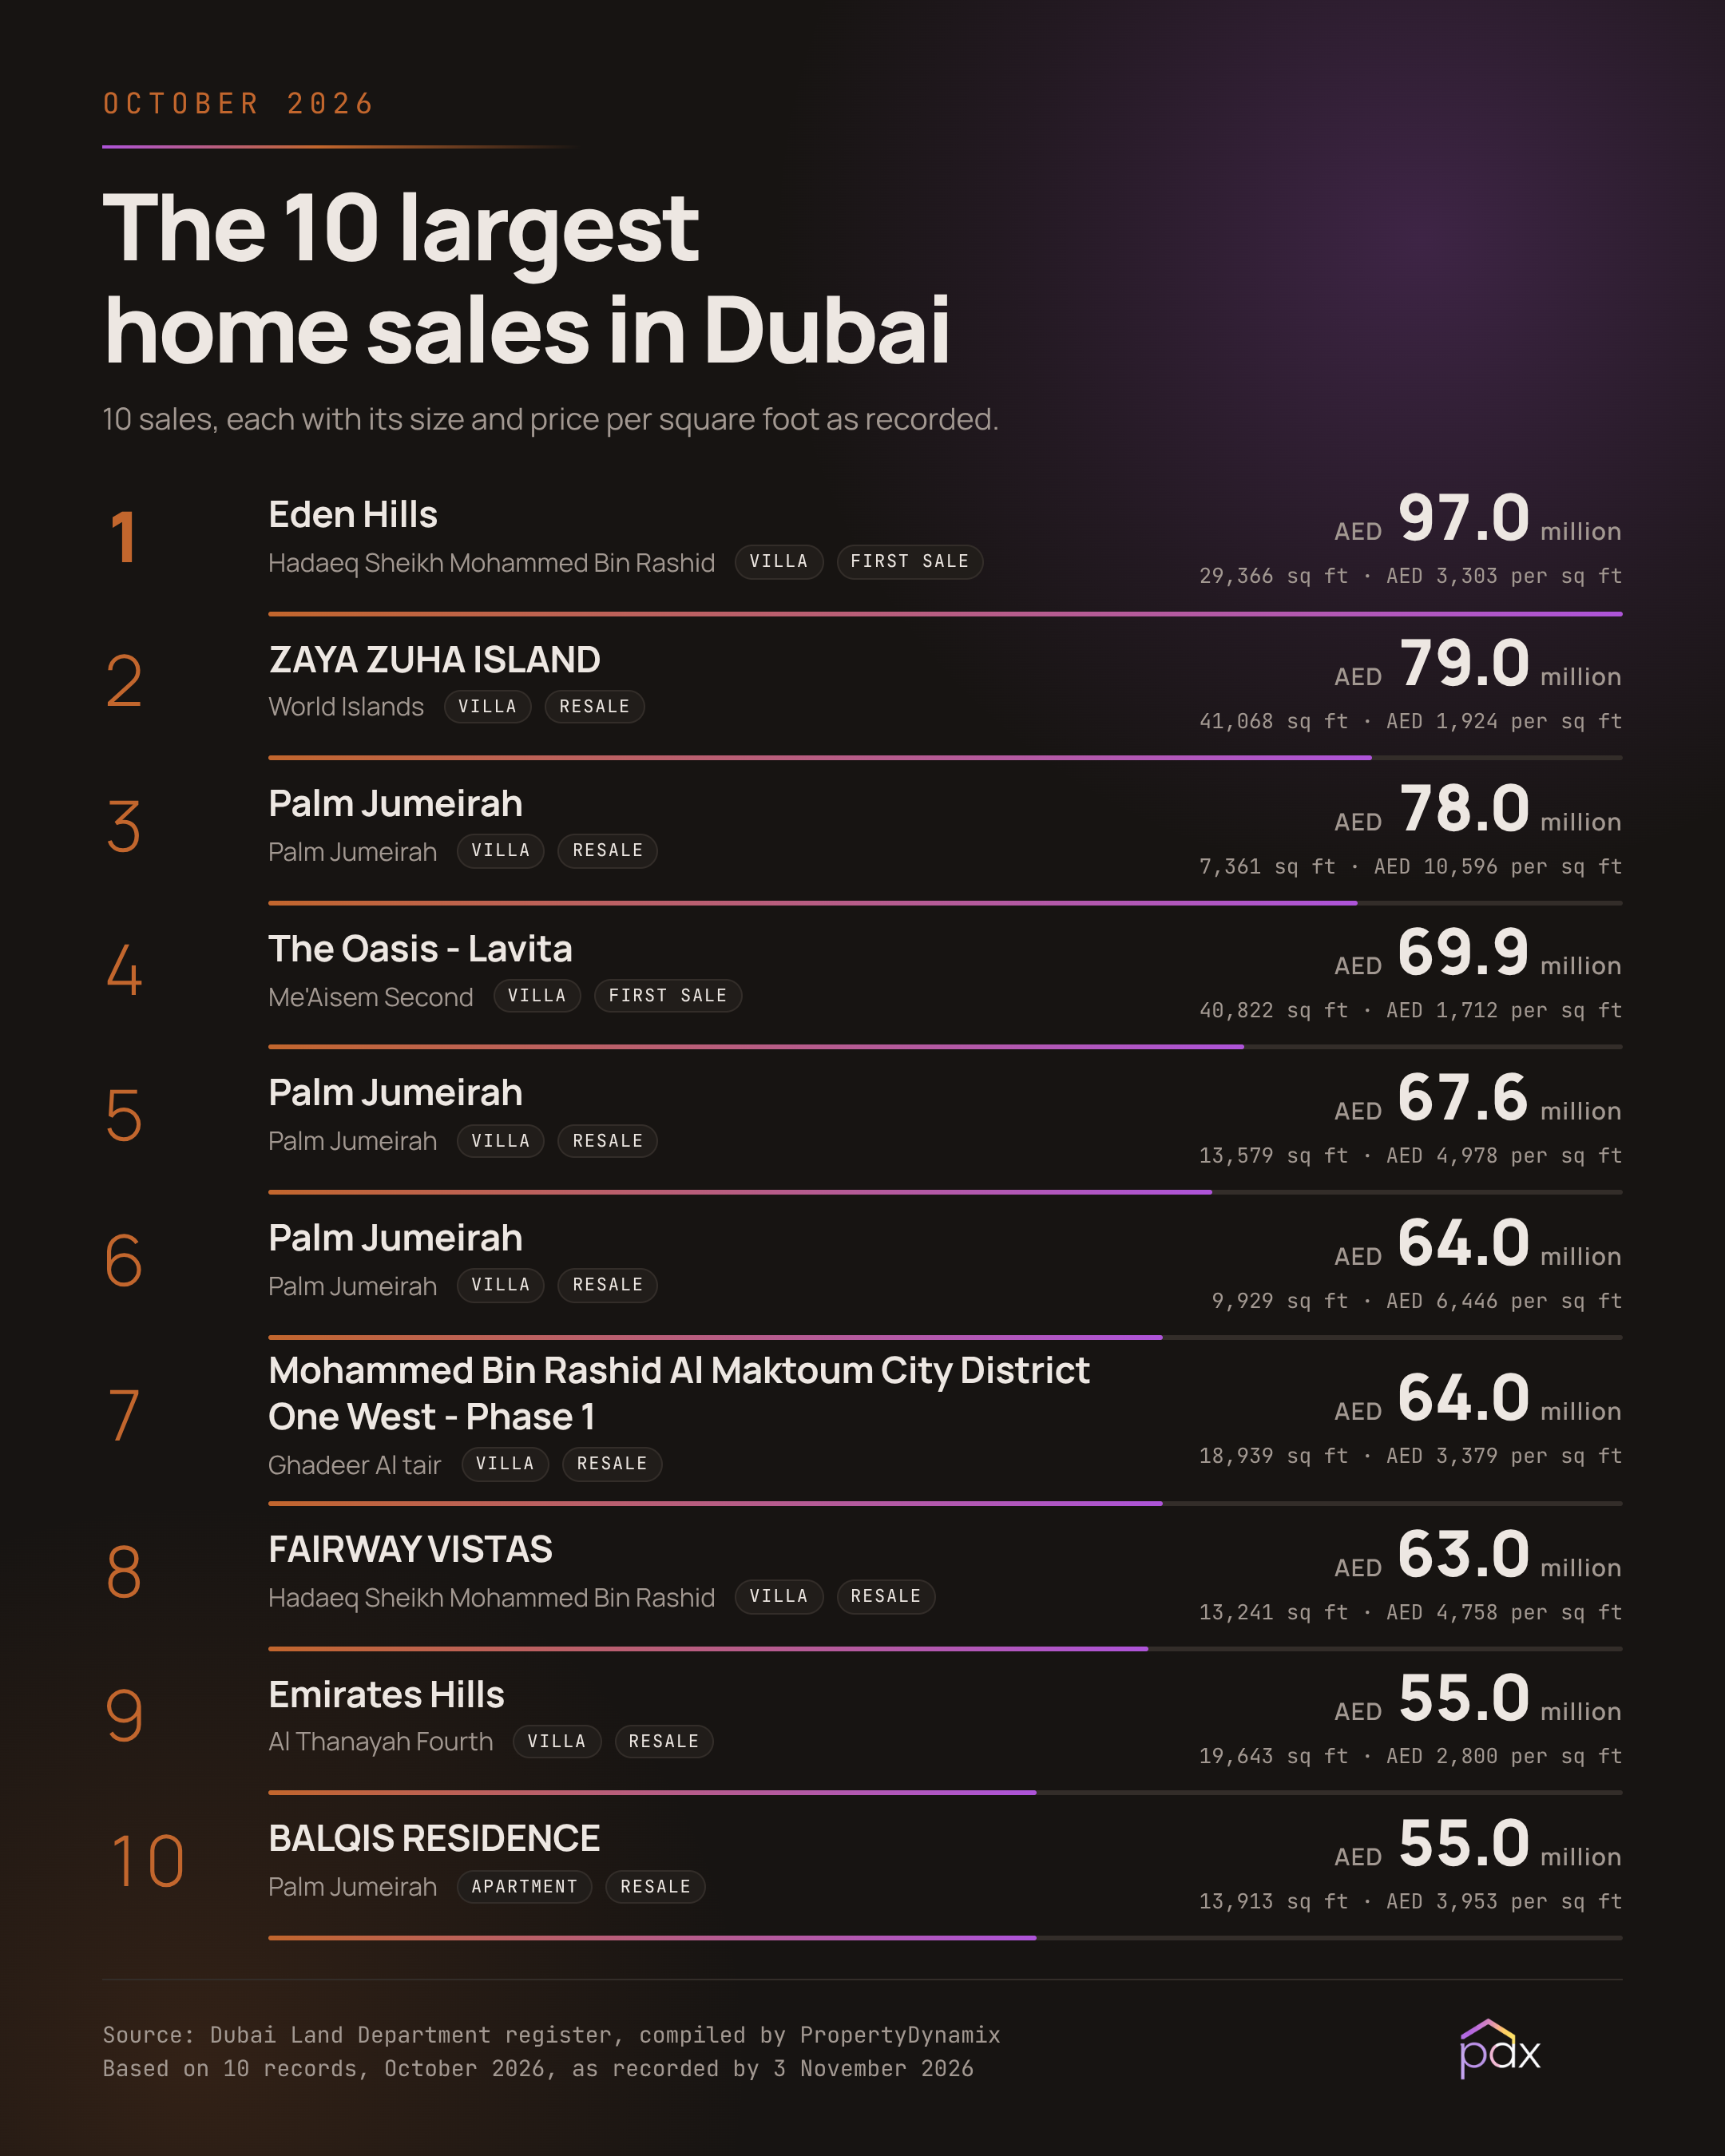

| Project | Community | Type | Price | Size (square feet) | Price per square foot |
|---|---|---|---|---|---|
| Eden Hills | Hadaeq Sheikh Mohammed Bin Rashid | Villa | AED 97.0 million | 29,366 | 3,303 |
| ZAYA ZUHA ISLAND | World Islands | Villa | AED 79.0 million | 41,068 | 1,924 |
| Palm Jumeirah | Palm Jumeirah | Villa | AED 78.0 million | 7,361 | 10,596 |
| The Oasis - Lavita | Me'Aisem Second | Villa | AED 69.9 million | 40,822 | 1,712 |
| Palm Jumeirah | Palm Jumeirah | Villa | AED 67.6 million | 13,579 | 4,978 |
| Palm Jumeirah | Palm Jumeirah | Villa | AED 64.0 million | 9,929 | 6,446 |
| Mohammed Bin Rashid Al Maktoum City District One West - Phase 1 | Ghadeer Al tair | Villa | AED 64.0 million | 18,939 | 3,379 |
| FAIRWAY VISTAS | Hadaeq Sheikh Mohammed Bin Rashid | Villa | AED 63.0 million | 13,241 | 4,758 |
| Emirates Hills | Al Thanayah Fourth | Villa | AED 55.0 million | 19,643 | 2,800 |
| BALQIS RESIDENCE | Palm Jumeirah | Apartment | AED 55.0 million | 13,913 | 3,953 |
The largest residential sales the register recorded in the month. Project and community are printed as the register holds them. No sale is left out for being unusual, and price divided by size gives the last column, so any row can be checked against itself.
Rents
62,222 leases of every type in every use in October 2026. Median annual rent AED 80 per square foot.
- Against October 2025down 19.1% up 1.8%
- Against September 2026down 6.6% down 0.1%
- All registered leases fell 19.1 percent from a year earlier to 62,222 contracts, and fell 6.6 percent in contract count from September 2026. Leases reach the register weeks after they begin, leaving October 2026 registrations at 83.7 percent of last year against 94.2 percent for settled July 2026.
- Registration lag does not distort middle rent per square foot, which rose 1.8 percent from a year earlier to AED 80 across all leases. In thin segments such as commercial villas, just 10 new contracts and 14 renewals registered, making those middle rent readings swing from month to month.
Residential
51,926 leases of every type registered for Residential use in October 2026. Median annual rent AED 78 per square foot.
- Against October 2025down 15.6% up 3.8%
- Against September 2026down 7.3% up 0.1%
These figures count apartments and villas in every use the register records them under (Residential and Commercial), so they differ from the register's Residential line.
Moving in against staying put
| Lease | Median rent (AED) | Median, one year | Same homes, one year | Contracts |
|---|---|---|---|---|
| New lease | 70,000 | down 6.7% | down 6.55% | 27,194 |
| Renewal | 64,000 | up 1.6% | up 3.47% | 25,773 |
What a new tenant pays over a sitting one: 19.0% a year ago, 9.4% now.
- New leases rose 2.5 percent to 27,194 contracts, while same-homes rents for moving tenants fell 6.55 percent to AED 88.5 per square foot. Renewal contracts fell 29.8 percent to 25,773 leases as same-homes renewal rents rose 3.47 percent, cutting the gap from AED 12,000 to AED 6,000.
- New contracts reached 51.3 percent of leases, up from 42 percent, while middle new-lease rent fell 6.7 percent to AED 70,000. Middle renewal rent rose 1.6 percent to AED 64,000, while residential penthouse and office leases registered only 8 contracts between them.
Other property types ("Penthouse" and "Office"): 8 leases, not shown separately.
Apartment, registered for Residential use
46,923 leases of apartment property registered for Residential use in October 2026. Median annual rent AED 80 per square foot.
- Against October 2025down 15.9% up 3.4%
- Against September 2026down 6.2% down 0.2%
New
24,154 leases
up 3.0% against October 2025, from 23,443
Renewal
22,769 leases
down 29.6% against October 2025, from 32,362
- New 24,154, 51.5%
- Renewal 22,769, 48.5%
- Apartments accounted for 46,923 of the 51,926 residential leases registered this month, with new contracts taking 24,154 leases against 22,769 renewals. Apartment lease counts fell 6.2 percent from 50,021 in September 2026, compared with a 7.3 percent fall across all residential leases.
Villa, registered for Residential use
4,995 leases of villa property registered for Residential use in October 2026. Median annual rent AED 67 per square foot.
- Against October 2025down 12.2% up 4.2%
- Against September 2026down 16.4% up 0.3%
New
2,720 leases
up 4.2% against October 2025, from 2,610
Renewal
2,275 leases
down 26.1% against October 2025, from 3,080
- New 2,720, 54.5%
- Renewal 2,275, 45.5%
- Middle villa rent per square foot rose 4.2 percent from AED 64 last year to AED 67, and rose 0.3 percent from AED 66. That 4.2 percent annual villa rent gain outpaced the 3.8 percent rent rise to AED 78 per square foot across all residential leases.
Residential and commercial uses, counted rather than read one by one
| Kind of property | Records, October 2026 | Against September 2026 |
|---|---|---|
| Registered for Residential use, other than apartments and villas | 8 | |
| Smaller groups: Office and Penthouse | 8 | |
| Registered for Commercial use | 10,296 | down 2.6% |
| Office | 6,011 | down 1.1% |
| Retail | 2,822 | down 3.6% |
| Apartment | 1,025 | down 4.0% |
| Hotel Apartment | 414 | down 13.2% |
| Smaller groups: Villa | 24 |
Each group's first line is its total, and the lines beneath it add up to that total. These are other kinds of property, or uses where other property makes up most of the records. They are counted here, not given a section of their own.
What it means for developers, investors and others
Developer
- Off plan apartment registrations absorbed the steepest share of the annual value drop, leaving new launches facing a smaller buyer pool.
- Communities leading monthly sales value also hold the largest pipelines of unfinished homes, meaning upcoming handovers will compete directly with active off plan phases.
Investor
- Rents for incoming tenants fell faster than same-homes purchase prices, compressing the initial rental return available on newly acquired properties.
- Renewal rents continued to rise while move-in rents fell, narrowing the rent gap between staying put and moving to a different home.
Analyst
- Headline middle prices overstated the decline because the mix of sales shifted, whereas matched home groups showed barely any capital repricing over the year.
- Studio share movements flipped direction once the leading seller was excluded, showing why market-wide size shares must be read alongside seller concentration.
How PropertyDynamix helps you read the register
We read the Dubai and Abu Dhabi government registers directly so every number traces to a recorded sale or lease.
- We separate same-homes price movement from shifts in what sold across 18 matched groups of property type, size, and sale channel.
- We publish mix and price figures both with and without the leading contributor so a single seller never distorts the market reading.
- We split lease registrations between incoming tenants and renewals, tracking the same-homes rent gap across matched communities.
- MOIRA answers plain-English questions about any building or community and shows the full register working behind every figure.
This review is built the way our platform works every day: MOIRA, our market intelligence assistant, answers questions about any building or community in Dubai with the working shown; the Market Terminal puts the registry behind every figure here at your fingertips; and pricing tools turn it into unit-by-unit pricing. Start free or read every edition.
What MOIRA expects next
LOW CONFIDENCE
MOIRA is the engine that read the registry behind every figure above. What follows is a projection from that evidence, not a record of it.
On balance, the evidence for November 2026 leans toward apartment and villa sales holding near the October 2026 run rate of 10,180 deals. Prior monthly transitions moved up 2.2 percent in 2023 sales, down 31.1 percent in 2024 sales, and down 4.8 percent in 2025 sales. Same-homes prices fell 0.67 percent across all developers and fell 0.33 percent excluding the leading contributor, which held 11.6 percent of apartment and villa sales. The register holds 426,466 unfinished homes, and 32,000 second-half handovers were projected as reported by Khaleej Times on 20 August 2026, restraining near-term price gains. Financing leans supportive as banks finance up to 75 percent of off plan project costs, reported by AGBI on 23 July 2026. Macro conditions stay mixed with US policy interest rates held at 3.5 to 3.75 percent as reported by US Federal Reserve on 29 July 2026. Tensions between countries as Brent oil reached 90.32 dollars, reported by The National on 20 July 2026, offset a softer dollar against European currencies.
In plain words. Our projection for November points toward activity staying near the 10,180 apartment and villa sales recorded this month. Prices for similar homes barely changed, falling 0.67 percent compared with a year earlier. Many newly finished homes are opening up, which balances out new residents needing housing.
 Market sentiment: Weak, 19 of 100 (measured from 5 registry figures: 1 rose, 4 fell, 0 steady; outside conditions moved it down 1). The score is measured from the period itself: five registry figures, each counting plus one when it rose on the year, minus one when it fell, and zero inside a deadband so rounding cannot vote. Outside conditions the review weighed adjust that reading by at most ten points either way, so the same period scores the same however it is written up.
| What we weighed | Ground | Leans | On what evidence | Source |
|---|---|---|---|---|
| Same-homes prices held while sales volume dropped | registry | mixed | Same-homes prices fell 0.67 percent while apartment and villa sales fell 44.3 percent to 10,180 deals | Dubai Land Department register |
| Wide historical spread in late-year monthly sales moves | seasonality | restraining | Prior monthly transitions moved +2.2 percent in 2023 sales, -31.1 percent in 2024 sales, and -4.8 percent in 2025 sales | Dubai Land Department register |
| Scheduled second-half completions alongside slower project launches | supply | restraining | Full-year 2026 deliveries are projected at 55,600 units as reported by Khaleej Times on 20 August 2026 | Khaleej Times on 20 August 2026 |
| Bank and developer partnerships expanding off plan mortgages | financing | supportive | Banks partnered with developers to finance up to 75 percent of off plan costs as reported by AGBI on 23 July 2026 | (4) |
| US Federal Reserve holding policy interest rates unchanged | macro | restraining | The Federal Open Market Committee kept federal funds interest rates at 3.5 to 3.75 percent as reported by US Federal Reserve on 29 July 2026 | (5) |
| Regional strikes and Strait of Hormuz transit disruption | geopolitical | restraining | Brent oil reached 90.32 dollars a barrel amid Gulf strikes as reported by The National on 20 July 2026 | (6) |
| Removal of the minimum property value for the two-year investor visa | policy | supportive | Removing the AED 750,000 minimum lifted enquiries for ready homes below AED 750,000 as reported by Khaleej Times on 1 July 2026 | (7) |
| Population growth after the spring dip | demand | supportive | Dubai population reached 4.74 million by June 2026 as reported by The National on 4 August 2026 | (8) |
| Fortnightly outlook model for Dubai series that passed validation | model | mixed | the model's own gate refused this horizon on one series. Passing December 2026 series show -0.32 and 0.15 percent moves, with 0 of 0 ranges held. | the outlook model run of 1 November 2026 |
| Fortnightly outlook model series where validation refused the horizon | model | mixed | the model's own gate refused this horizon. The model beat no change only on the earlier months it was picked on. | the outlook model run of 1 November 2026 |
This reading is a projection rather than a forecast, and it describes a direction rather than a specific number. A single large developer launch, a policy change, or a shift in regional conditions can move the outcome.
Methodology and assumptions
- What we read. Dubai Land Department registrations for October 2026, as recorded by 3 November 2026: 11,210 sales and 62,222 leases.
- How the sections are cut. By the register's own labels, in this order: 1. the register: sales, then leases; 2. what the property is used for, as the register records it; 3. the type of property, as the register records it; 4. off plan or ready for a sale, new or renewed for a lease. The biggest groups come first. A group with too few records to read on its own is counted with the rest rather than read alone.
- Prices. A few sales far above or below the rest are left out of prices but kept in counts. Apartment prices use built area and villa prices use plot area, so the two are not compared.
- Who sold. Sales are split as the register files them. For October 2026: 6,366 first sales and 3,813 resales. First sales are homes the register records as sold for the first time, usually by their developer. The register often records an off plan home resold before it is built the same way, so some are resales. Resales are homes the register records as sold on by an owner after their first sale. Same-homes prices are matched by property type, bedroom count and kind of sale, so a shift from one kind of sale to another cannot move them.
- How we compare. Each figure is compared with October 2025 and September 2026.
- How reasons are weighed. First the register's own figures are asked, in this order: 1. Is the register still filling, or has it restated a period it already printed? 2. Did prices move, or did the mix of homes sold move? 3. Is the comparison distorted by the calendar? 4. Is the move larger than this market's ordinary variation? Each answer can end the question. Only what is left goes to dated news. Each report faces these checks, in order: 1. Came before the move. 2. Pushes the way the market moved. 3. Fits which side of the market moved. 4. Hits the parts it should hit hardest. 5. Large enough for a move this size. 6. Has done this here before. A report from after the move cannot explain it, so the first check decides alone. A check we cannot run is left out, never counted as zero. The likelihood words are stored with this edition, so they never change later.
MOIRA read 11,210 sales and 62,222 leases registered with the Dubai Land Department for October 2026. It checked 36 dated news reports from 6 publishers, and tested 12 possible explanations: 2 fit, 7 did not and 3 could not be measured.
Read on. Every monthly edition · Previous edition: September 2026 · How the review is made
How these figures were checked
3 earlier figures updated since we first printed them
| Month | Measure | First recorded | Recorded now | Against usual late registrations |
|---|---|---|---|---|
| August 2026 | Apartment and villa sales | 10,852 | 11,056 | |
| August 2026 | Total value, AED billion | 22.02 | 24.00 | No pattern for this measure |
| August 2026 | Median price per square foot, AED | 1,708 | 1,715 | No pattern for this measure |
What would change our mind
- Fewer new projects going on sale (1): The number of new projects going on sale was normal.
- Lower market rents (3): Rent as a share of price moved a lot, so prices moved apart from rents rather than with them.
These fit, but how much each accounts for could not be measured.
- More completion delays (homes finishing later than scheduled) (2)
- More new homes finished at once (2)
- Tighter rent rules (rules on how much rents may rise) (9)
The causes weighed above also fit other moves. Home sizes moved by very different amounts: 5 of them. Prices ran ahead of rents: 5 of them.
No dated report was weighed against rents on their own this month.
1 possible cause is set aside and not weighed, because the report behind it does not say which way it moved.
Prices ran ahead of rents: 1 chart for October 2026
Prices for the same kinds of home fell 0.67 percent while new-lease rents fell 6.55 percent, a gap of 5.88 percentage points (the difference between the two percentages). Prices held up better than what a home earns from letting, so each dirham of rent now costs more to buy.
Median residential sales price and rate by area: shown under "Residential".
One to put to your own figures: Did rental returns soften in your focus areas as rents fell faster than sale prices?
1 check not measured this edition.
- Median residential lease rate and rent by area: not measured (its 127 figures run from 5 to 174 AED per sq ft and 2 sit far outside the rest, more spread than one measure of the same thing can credibly hold, so it is held back rather than printed)
5 checks we ran on October 2026
Before this report offers any reason for a move, it checks the register and then the month's own figures. Each one can end the question, and when one does we say so instead of reaching for a story.
The sections follow the register's own labels, in this order: 1. The register: sales, then leases. 2. What the property is used for, as the register records it. 3. The type of property, as the register records it. 4. Off plan or ready for a sale, new or renewed for a lease. This period gave 8 sections. 2 groups too thin to read alone are counted with the rest (8 records). 12 groups outside the review's own types of property are counted in one table.
Whether the register had finished filling.
Nothing here needs a reason- Between 13 October 2026 and 3 November 2026, 26 sale records dated in earlier months reached the register, against 0 to 2 expected from how 1 earlier month filled. More arrived than the pattern expects: a batch of late records landed at once, so figures for those months moved more than usual in that time.
- 3 earlier figures changed since first published, each within what late registrations explain or with no fill pattern to judge by.
Price change against the mix of homes sold.
Nothing here needs a reason- Prices held; what changed was which homes sold. The headline price fell 2.5 percent. But the same-homes measure moved by less than one percent. That measure compares this month with the same month last year, for the same types and sizes of home, sold the same way. A change in what sold cannot move it. Homes did not really reprice. What changed was which homes happened to sell.
The calendar and the comparison.
Nothing here needs a reason- Neither October 2026 nor October 2025 includes Ramadan, so the comparison with last year is not distorted by it.
- The month had 22 working days against 22 the month before. The calendar barely moved the raw count.
The move against this market's ordinary variation.
Nothing here needs a reason- An ordinary change for a month. Sales rose 0.9 percent against the month before. Half the months in the last 1 year moved at least as much. This is an ordinary change and it does not need a special explanation.
Outside explanations for what is left.
5 offered, 7 ruled out
Explanations we checked and rejected. We weighed 12 candidate explanations against this month's figures. 7 did not fit, and these are the 2 a reader is most likely to have already had in mind.
- A lower property value threshold for the visa (a new price threshold for residency changes what buyers aim for). This factor pushes up and the market went the other way. That is evidence against it.
- The region feeling riskier. This factor should have left volume down, price up. What actually happened was volume down, price down. The shape is wrong, which counts against it more heavily than a missing piece of supporting evidence would.
Possible explanations are scored against our published factor library, version 1.3.0.
How to read the likelihood: "might be caused by" means the evidence here supports it up to about 65 percent. That is a ceiling set by the kind of evidence a cause rests on, not a measurement of each cause. Causes worded alike are not ranked against each other. These limits were set before the period began and are not yet checked against how earlier explanations held up.
How our method changed, in 1 note
- This run checked 0 past explanations against the register. Across every earlier edition, 278 explanations carry a test written in words the register cannot check.
How these figures were made, in 6 notes
Coverage. Headline figures cover October 2026 apartment and villa sales recorded by the DLD, the government body that records every property sale in Dubai. Commercial and other non-residential transactions are excluded from these headline figures and reported on their own register lines. This edition reads October 2026 as recorded by 3 November 2026, and comparisons use earlier months as recorded now.
Prices. Outliers, meaning sales priced far from others that would drag the middle price off course, are excluded from price figures but kept in counts. A group must meet the minimum transaction count for a middle price to be published. Apartment prices per square foot use built area while villa prices use plot area, so the two never compare. The same-homes measure tracks 18 matched groups of homes of the same type and size, which the industry calls like for like.
Rentals. Leases reach the register weeks after they begin, so the October 2026 lease count shows what had registered by the run and rises afterwards. Because the comparison month a year earlier is complete, a fall in the contract count against the same month a year earlier overstates the drop. Each rent level is the midpoint of registered leases, the middle rent with half above it and half below, compared with a year earlier. October 2026 lease registrations stood at 83.7 percent of the prior year month, compared with 91.7 percent in September 2026.
Attribution. Apartment and villa sales with no bedroom recorded rose from 0.3 percent in October 2025 to 0.5 percent in October 2026. All bedroom size shares, including the 24.8 percent studio share and 26.6 percent share excluding the leading contributor, use tagged sales only.
Off plan. An off plan home is a property sold before it is built, whether sold by its developer or resold by an earlier buyer. Because the register often records an off plan resale in the same form as a developer first sale, off plan figures cover both. Figures for earlier months can also change as late registrations reach the register, which this report tracks in its vintage reading.
Beyond residential. The headline figures leave out Office, Hotel Apartment, Retail, Building and Land: 1,030 sales in October 2026. Each is reported apart, in its own section or in the counted groups. None is mixed into the headline figures or their prices.
1 table or chart no section above used
These figures count apartments and villas in every use the register records them under (Residential and Commercial), so they differ from the register's Residential line.
| Measure | A year ago | This month | Change |
|---|---|---|---|
| Contracts registered | 63,252 | 52,967 | down 16.3% |
| Median annual rent (AED) | 68,000 | 67,000 | down 1.5% |
| Median rent per square foot (AED) | 77 | 79 | up 3.2% |
| 1-bedroom, median (AED) | 60,000 | 60,809 | up 1.3% |
| 2-bedroom, median (AED) | 78,750 | 80,049 | up 1.6% |
| New contracts, share of leases | 42.0% | 51.3% |
Leases reach the register weeks after they begin, so October 2026 shows what had been registered by the run and will rise. Registrations for October 2026 stood at 83.7 percent of the prior year month, while settled months such as July 2026 reached 94.2 percent. Rent levels are medians of registered leases and compare with the same month last year, so lag does not distort them like contract counts.
Sources
| No. | Publisher | Title | Date | Link |
|---|---|---|---|---|
| Dubai Land Department | Sales and leases registers | Read 3 November 2026 | ||
| 1 | Khaleej Times | Full-year 2026 delivery forecast and construction progress | 20 August 2026 | Link |
| 2 | Khaleej Times | H1 2026 handovers and forward pipeline | 30 July 2026 | Link |
| 3 | Gulf News | CBRE Q2 2026 rents and volumes | 29 July 2026 | Link |
| 4 | AGBI | Off plan mortgage financing shift | 23 July 2026 | Link |
| 5 | US Federal Reserve | US Fed rate decision | 29 July 2026 | Link |
| 6 | The National | July escalation and Brent $90 | 20 July 2026 | Link |
| 7 | Khaleej Times | Two-year property investor visa | 1 July 2026 | Link |
| 8 | The National | Population | 4 August 2026 | Link |
| 9 | Khaleej Times | Rental index for shared housing units | 6 August 2026 | Link |
Also read, not used for a reason
| Publisher | Title | Date | Link |
|---|---|---|---|
| Gulf News | Launch slowdown and H2 2026 delivery expectations | 30 July 2026 | Link |
| Khaleej Times | Q2 2026 launches and handovers | 16 July 2026 | Link |
| Khaleej Times | DLD completed projects H1 2026 | 20 August 2026 | Link |
| Khaleej Times | Completions versus schedule | 21 July 2026 | Link |
| AGBI | Construction costs and contractor capacity | 20 July 2026 | Link |
| The National | Contractor cost absorption and project schedules | 1 July 2026 | Link |
| Khaleej Times | ValuStrat VPI July 2026 | 12 August 2026 | Link |
| Khaleej Times | July ready vs off plan mix | 12 August 2026 | Link |
| Khaleej Times | ValuStrat June 2026 reading | 15 July 2026 | Link |
| Khaleej Times | Savills Q2 2026 handovers and launches | 16 July 2026 | Link |
| Khaleej Times | Q2 correction and H2 supply (Cushman & Wakefield Core) | 9 August 2026 | Link |
| Gulf News | CBUAE base rate | 29 July 2026 | Link |
| Gulf News | US dollar, sterling and euro | 19 August 2026 | Link |
| Gulf News | UAE and Dubai PMI, July | 5 August 2026 | Link |
| Al Jazeera | Global equities | 5 August 2026 | Link |
| Gulf News | Airline seat capacity | 3 August 2026 | Link |
| Gulf News | Tourism and hotels H1 2026 | 18 August 2026 | Link |
| Gulf News | Business formation (DIFC) | 28 July 2026 | Link |
| AGBI | Employment and hiring (PMI) | 6 August 2026 | Link |
| Gulf News | Developer-bank off plan mortgage terms | 29 July 2026 | Link |
| Gulf News | CBUAE base rate decision | 29 July 2026 | Link |
| Gulf News | Shared housing law takes effect | 3 August 2026 | Link |
| AGBI | Dubai 2040 plan infrastructure milestone | 13 July 2026 | Link |
| The National | Hormuz closure and shipping collapse | 12 July 2026 | Link |
| Khaleej Times | Dubai property reaction to renewed tensions | 16 July 2026 | Link |
| AGBI | Foreign capital flows in Gulf equities | 17 August 2026 | Link |
| Al Jazeera | Memorandum expiry and Hormuz traffic | 20 August 2026 | Link |
Free account, no card
Go beyond the October 2026 review
This review is a summary of what the registry recorded. A free account opens the data behind it.
- The Market TerminalEnterprise-grade DLD analytics: every sale, rent and index behind this review, by area and project.
- MOIRA inside ChatGPT and ClaudeAsk the registry from the assistant you already use. See how it works
- New Launches and Promotions RadarEvery new project and developer offer, tracked. Opens when you verify your phone number.
- Each new review by emailThe month on two pages, the morning it is published.
No card required3-day free trial, 7 with a verified phoneYou come straight back here
Price with the market, not guesswork.
Live DLD and ADREC market intelligence, free to start with the Market Terminal.
Related posts
Apartment and villa sales fell 47 percent year on year (compared with the same period a year earlier) to 10,066 transactions. Same-homes prices excluding the leading contributor fell 5.42 percent.
Apartment and villa sales fell 47 percent to 10,066 transactions in September 2026, while same-homes prices excluding the leading contributor fell 5.42 percent.
13 October 2026
Apartment and villa sales fell 38.7 percent to 33,627 transactions in Q3 2026
Apartment and villa sales fell 38.7 percent to 33,627 sales in Q3 2026, while same-homes prices excluding the leading contributor fell 5.87 percent.
12 October 2026
Dubai Property Report August 2026: Same-Homes Prices Drop
Dubai same-homes property prices fell 5.17 percent in August 2026, while total sales dropped 36.4 percent to 10,852 transactions.
7 September 2026